What Does "Graph" Mean in Computing?
When buyers search for a computer for "graph" work, they usually mean one of three things: graph analytics and graph databases (such as Neo4j, TigerGraph, Amazon Neptune or JanusGraph), graph plotting and scientific visualization (MATLAB, R, Python with Matplotlib/NetworkX, Gephi), or graph rendering in dashboards and BI tools (Power BI, Tableau, Grafana, Kibana). Each workload has a different hardware profile, but all of them benefit from fast storage, adequate RAM and a stable, always-on platform rather than a battery-powered laptop.
Hardware Requirements by Graph Workload
Graph analytics is memory-hungry: graph traversal and shortest-path queries keep large portions of the graph resident in RAM, so 16GB is a sensible floor and 32GB or more is preferable for large datasets. Graph plotting and network visualization are more CPU-bound, with occasional bursts across multiple cores. Dashboard rendering is usually light on compute but demands 24/7 uptime, dual display output and reliable networking.
| Workload | Typical Software | RAM Priority | CPU Priority | Storage Priority |
|---|---|---|---|---|
| Graph database / analytics | Neo4j, TigerGraph, JanusGraph | High (16–64GB) | Medium–High | High (NVMe SSD) |
| Graph plotting / scientific | MATLAB, R, Python, Gephi | Medium (8–16GB) | High (multi-core) | Medium |
| Dashboard / graph rendering | Grafana, Kibana, Power BI | Medium (8–16GB) | Medium | Medium |
| Edge graph data collection | Custom agents, MQTT bridges | Low–Medium (4–8GB) | Low | Low–Medium |
Why Fanless and Always-On Matters
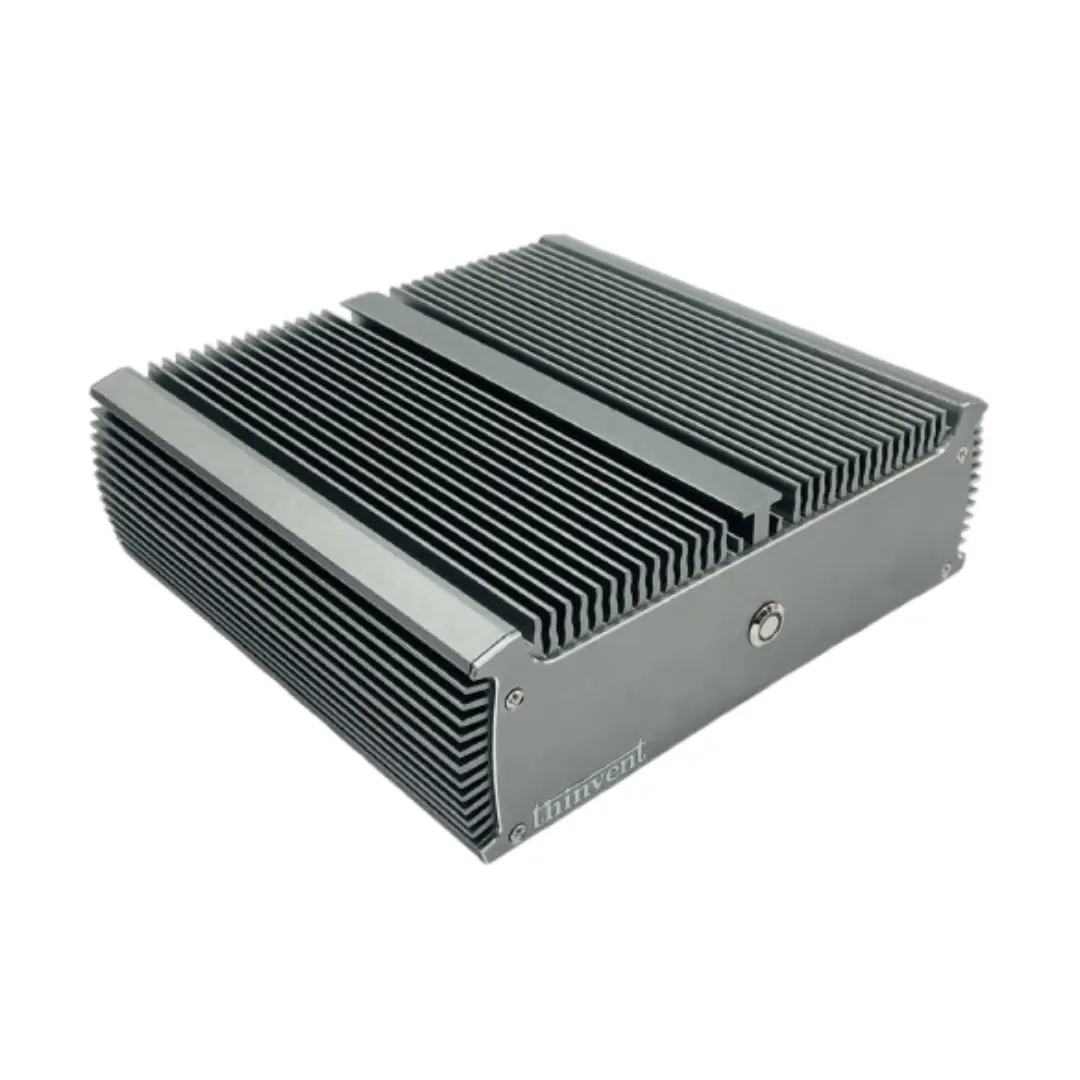
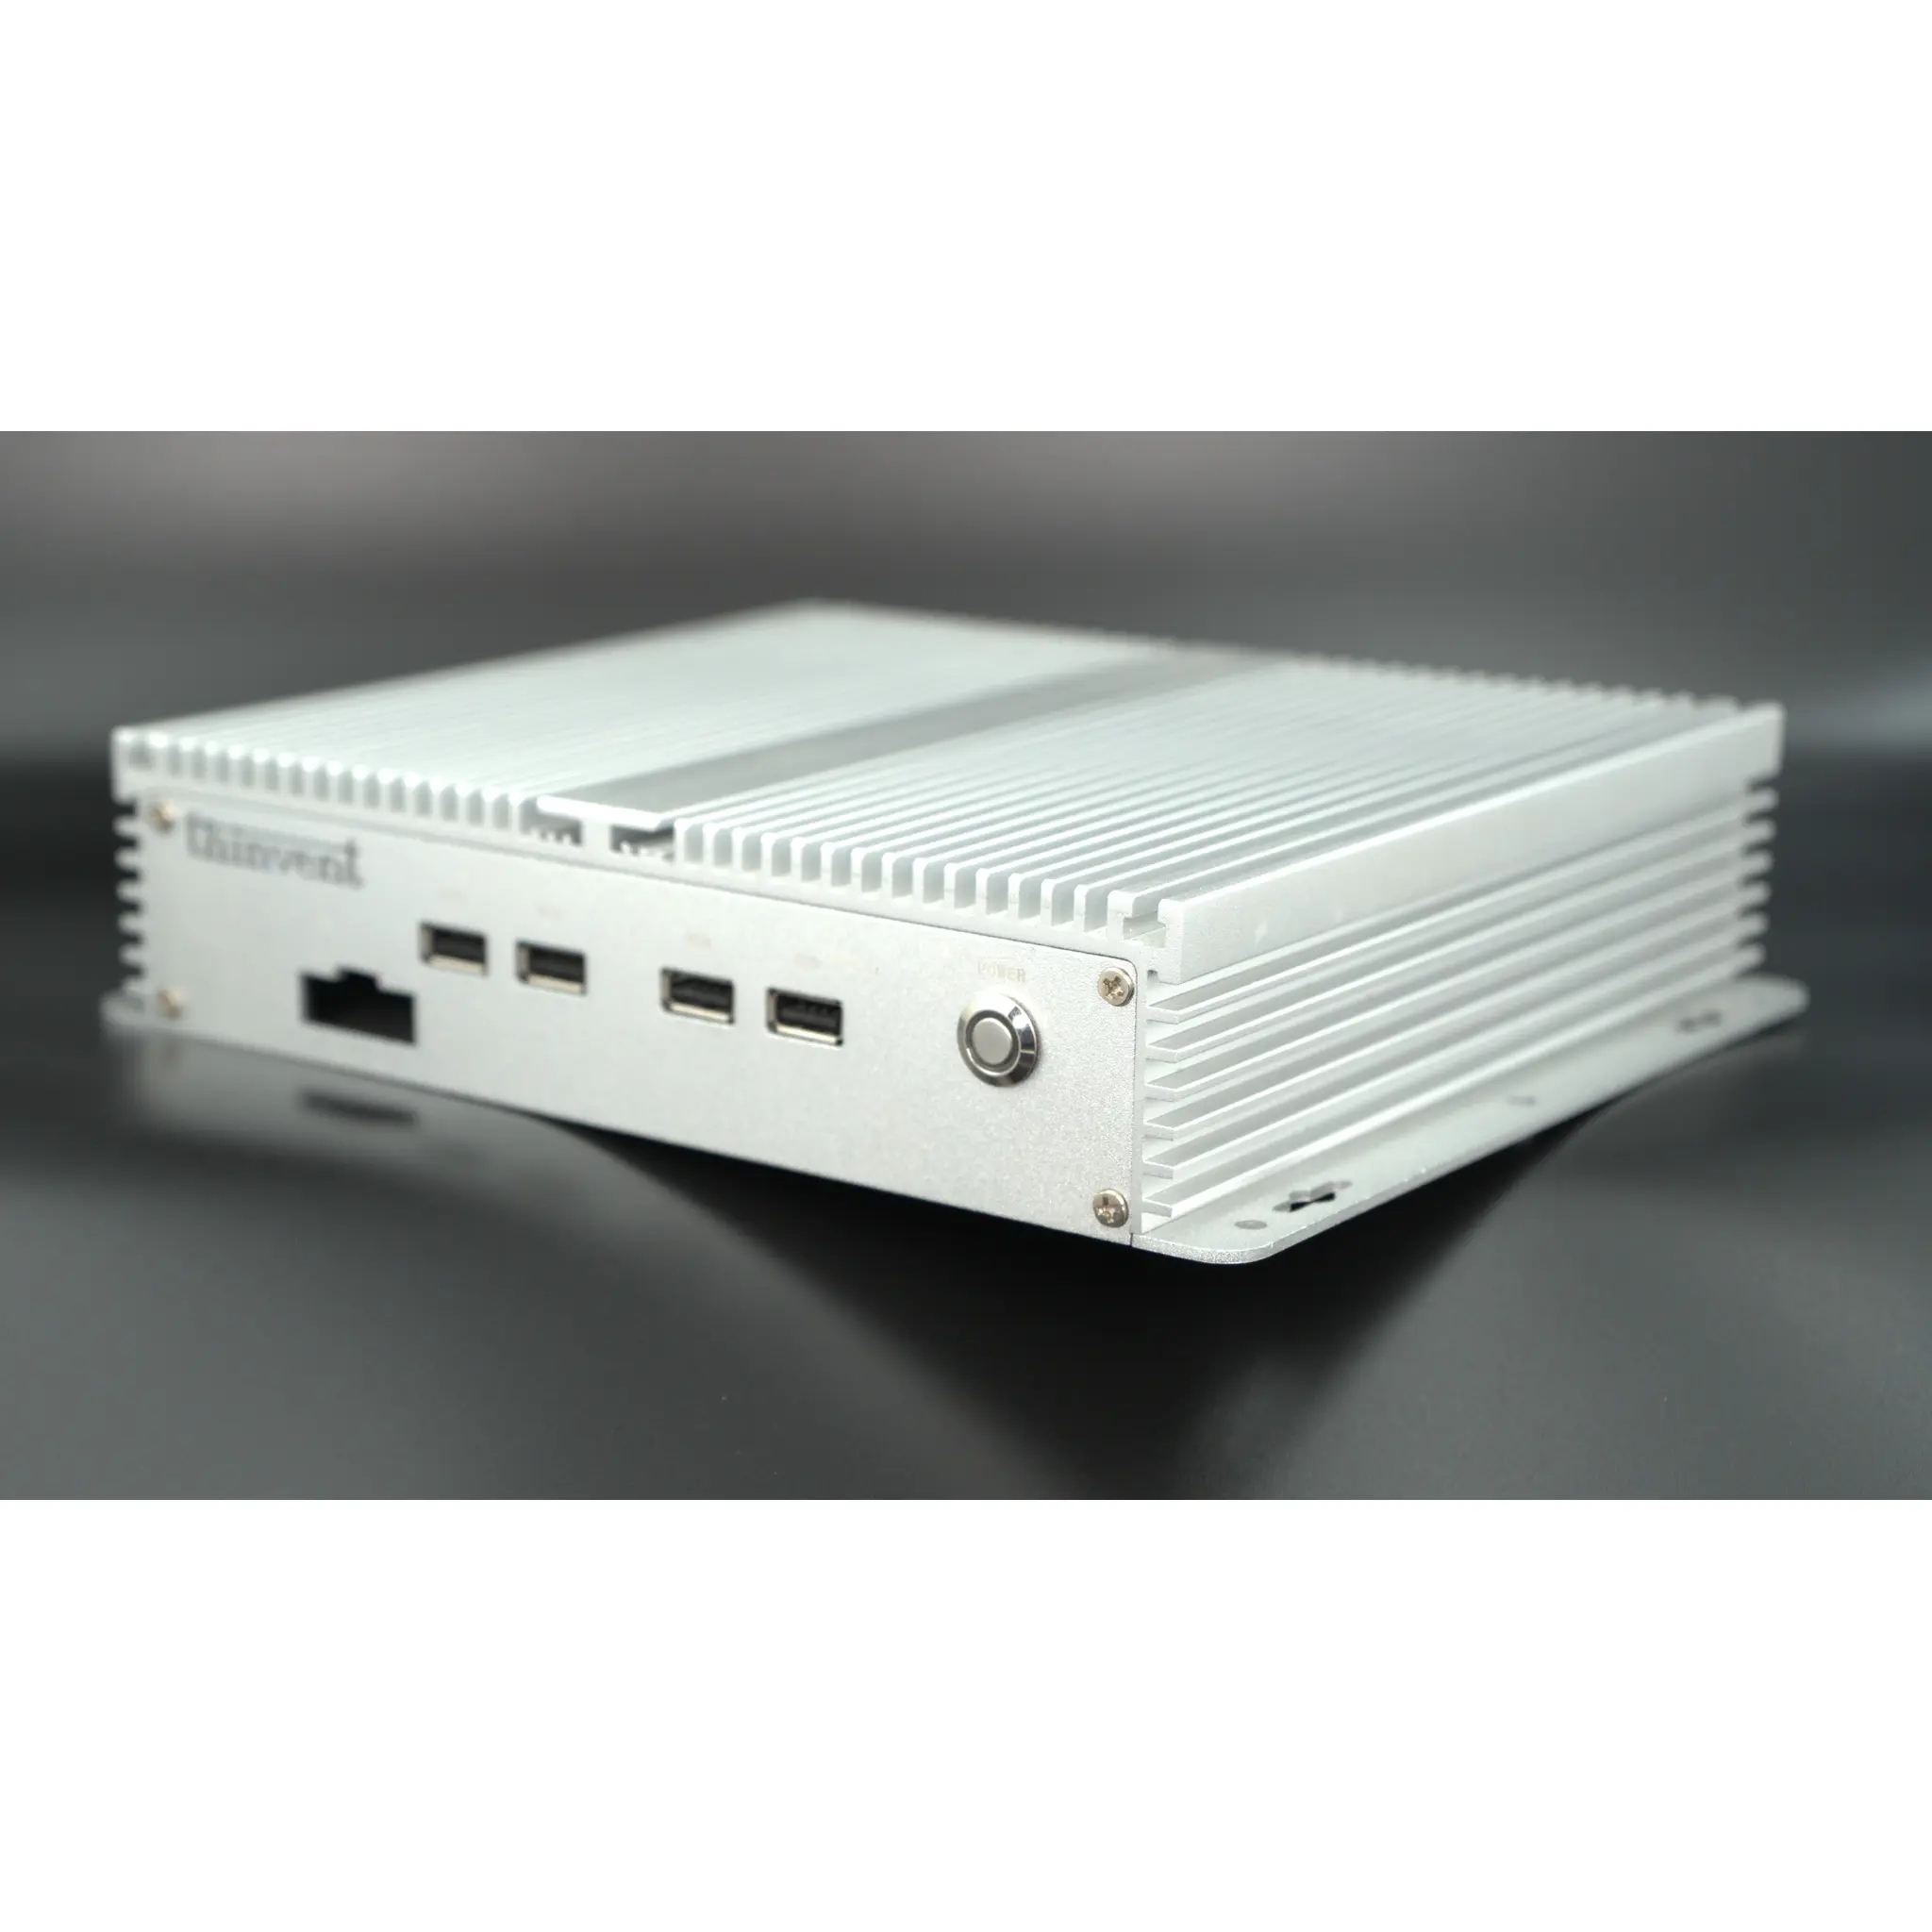
Graph servers and visualization nodes are often left running continuously in offices, labs, control rooms and shop floors. Fanless industrial designs remove the single most common point of mechanical failure, eliminate dust ingress through fan intakes, and allow operation across wide temperature ranges. Low-power Intel processors in the Celeron and N series are well suited to this: they deliver enough multi-core throughput for graph rendering and lightweight analytics while drawing only a few watts, so a sealed chassis stays cool without active airflow.
Deployment Scenarios
Typical deployments include a small on-premises graph database node for fraud detection or recommendation engines, a visualization workstation driving two monitors for network topology and supply-chain graphs, and a thin-client or mini PC acting as the display endpoint for a centralized graph analytics server. In factory and utility settings, the same hardware can run a local Grafana instance that graphs sensor trends from PLCs and meters, with data retained on a local SSD when the network is unavailable.
Choosing the Right Configuration
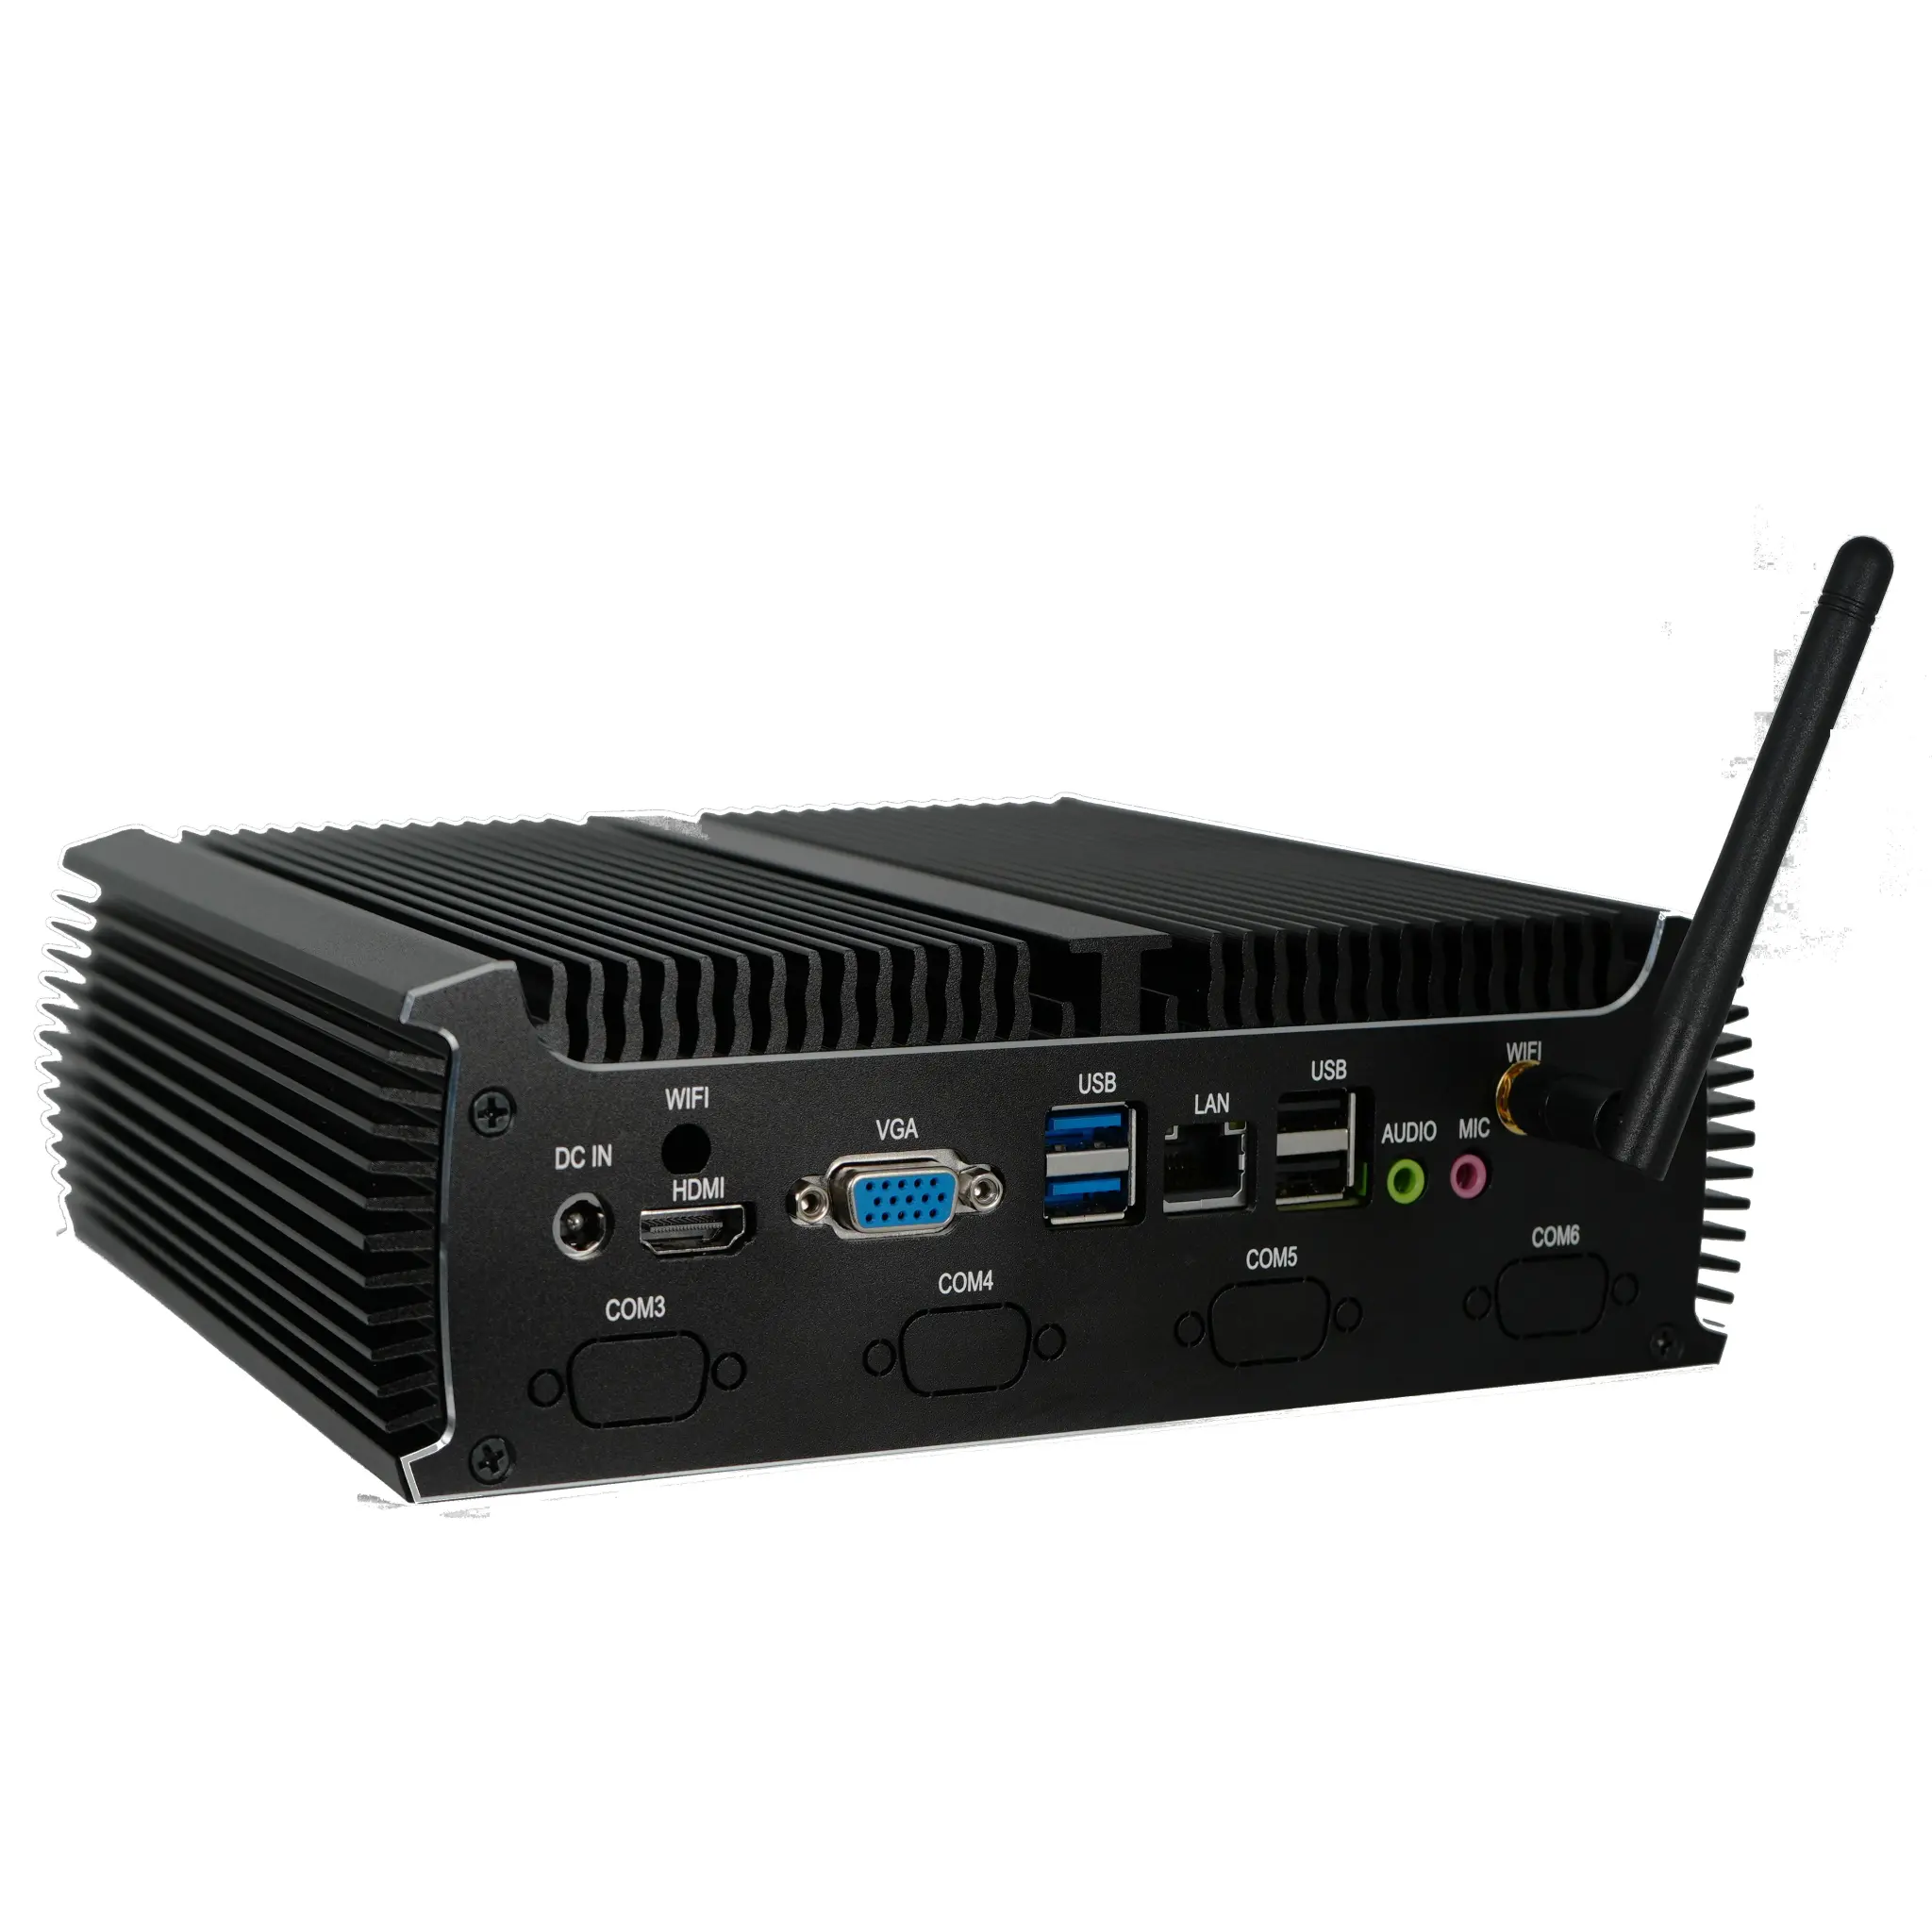
Match RAM to graph size first, then storage, then CPU. A 4-core Intel processor with 16GB RAM and a 128GB or larger SSD handles graph plotting, dashboards and small graph databases comfortably. For larger graphs or concurrent users, step up to 32GB or 64GB RAM and faster storage. Dual HDMI output is useful when one screen shows the graph and the other shows the underlying data table or query console. Ethernet with two ports allows separation of a management network from the data network, a common requirement in industrial and telecom environments.
Thinvent Products for Graph Workloads
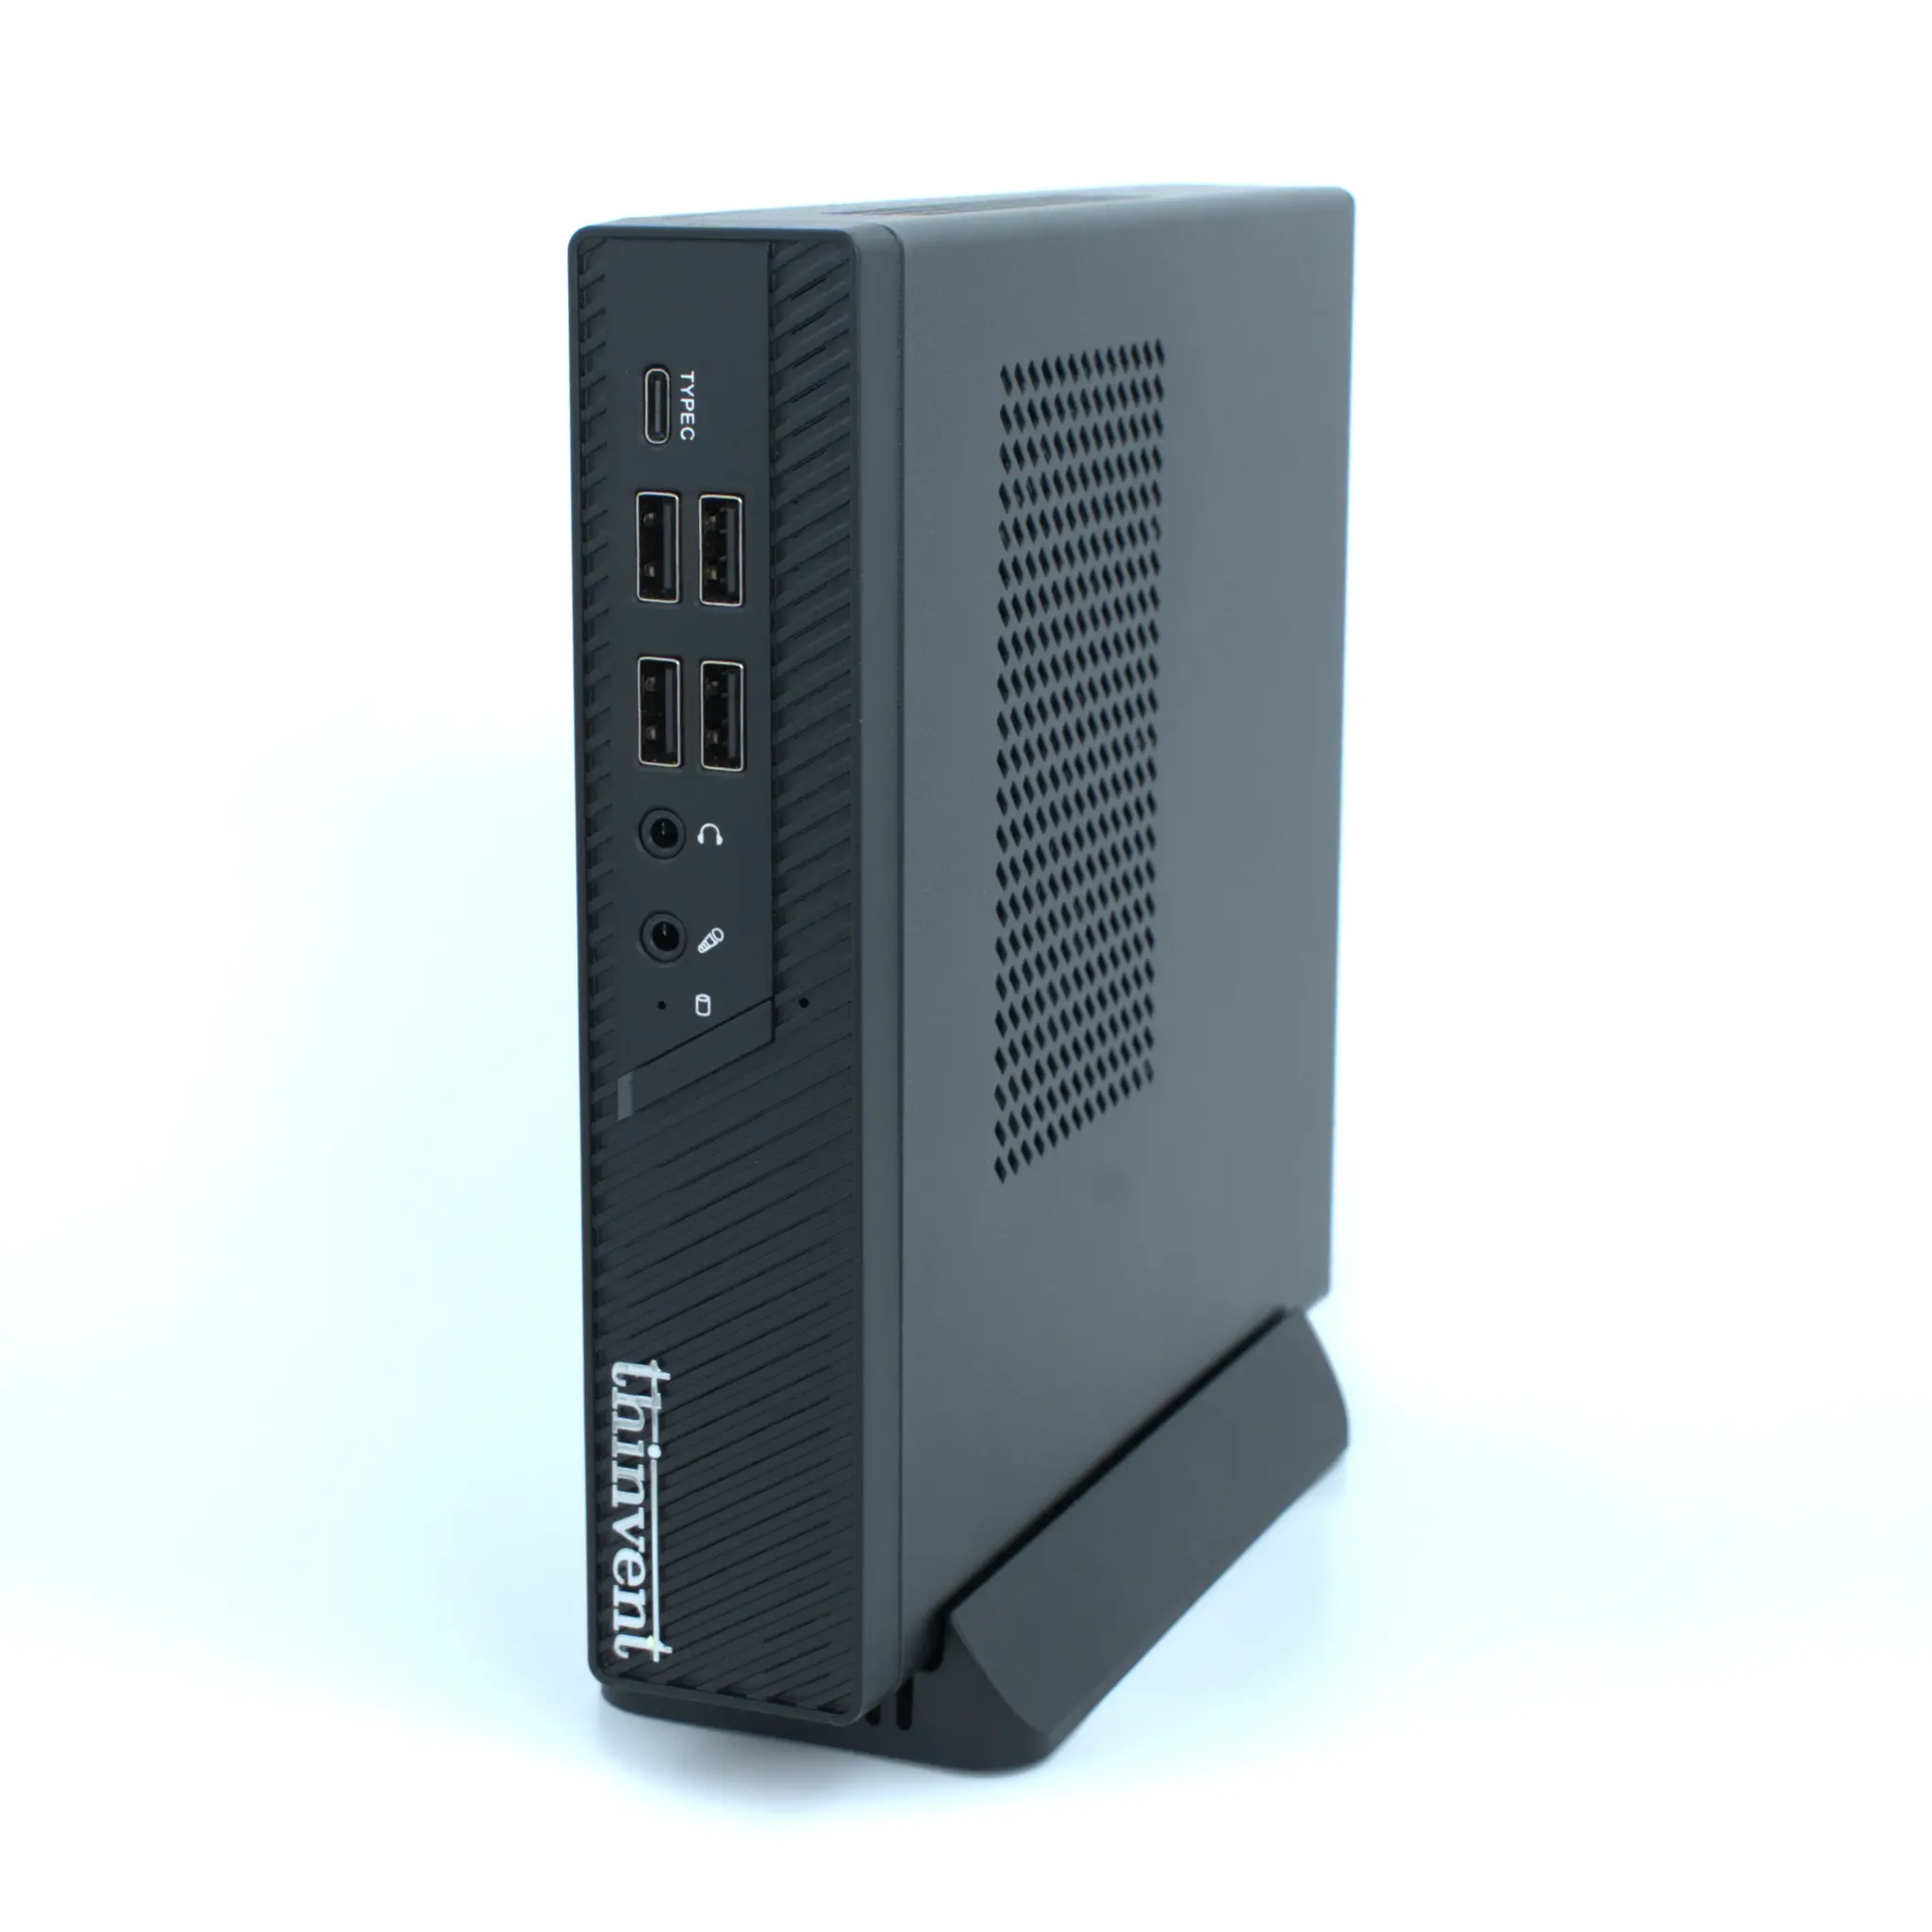
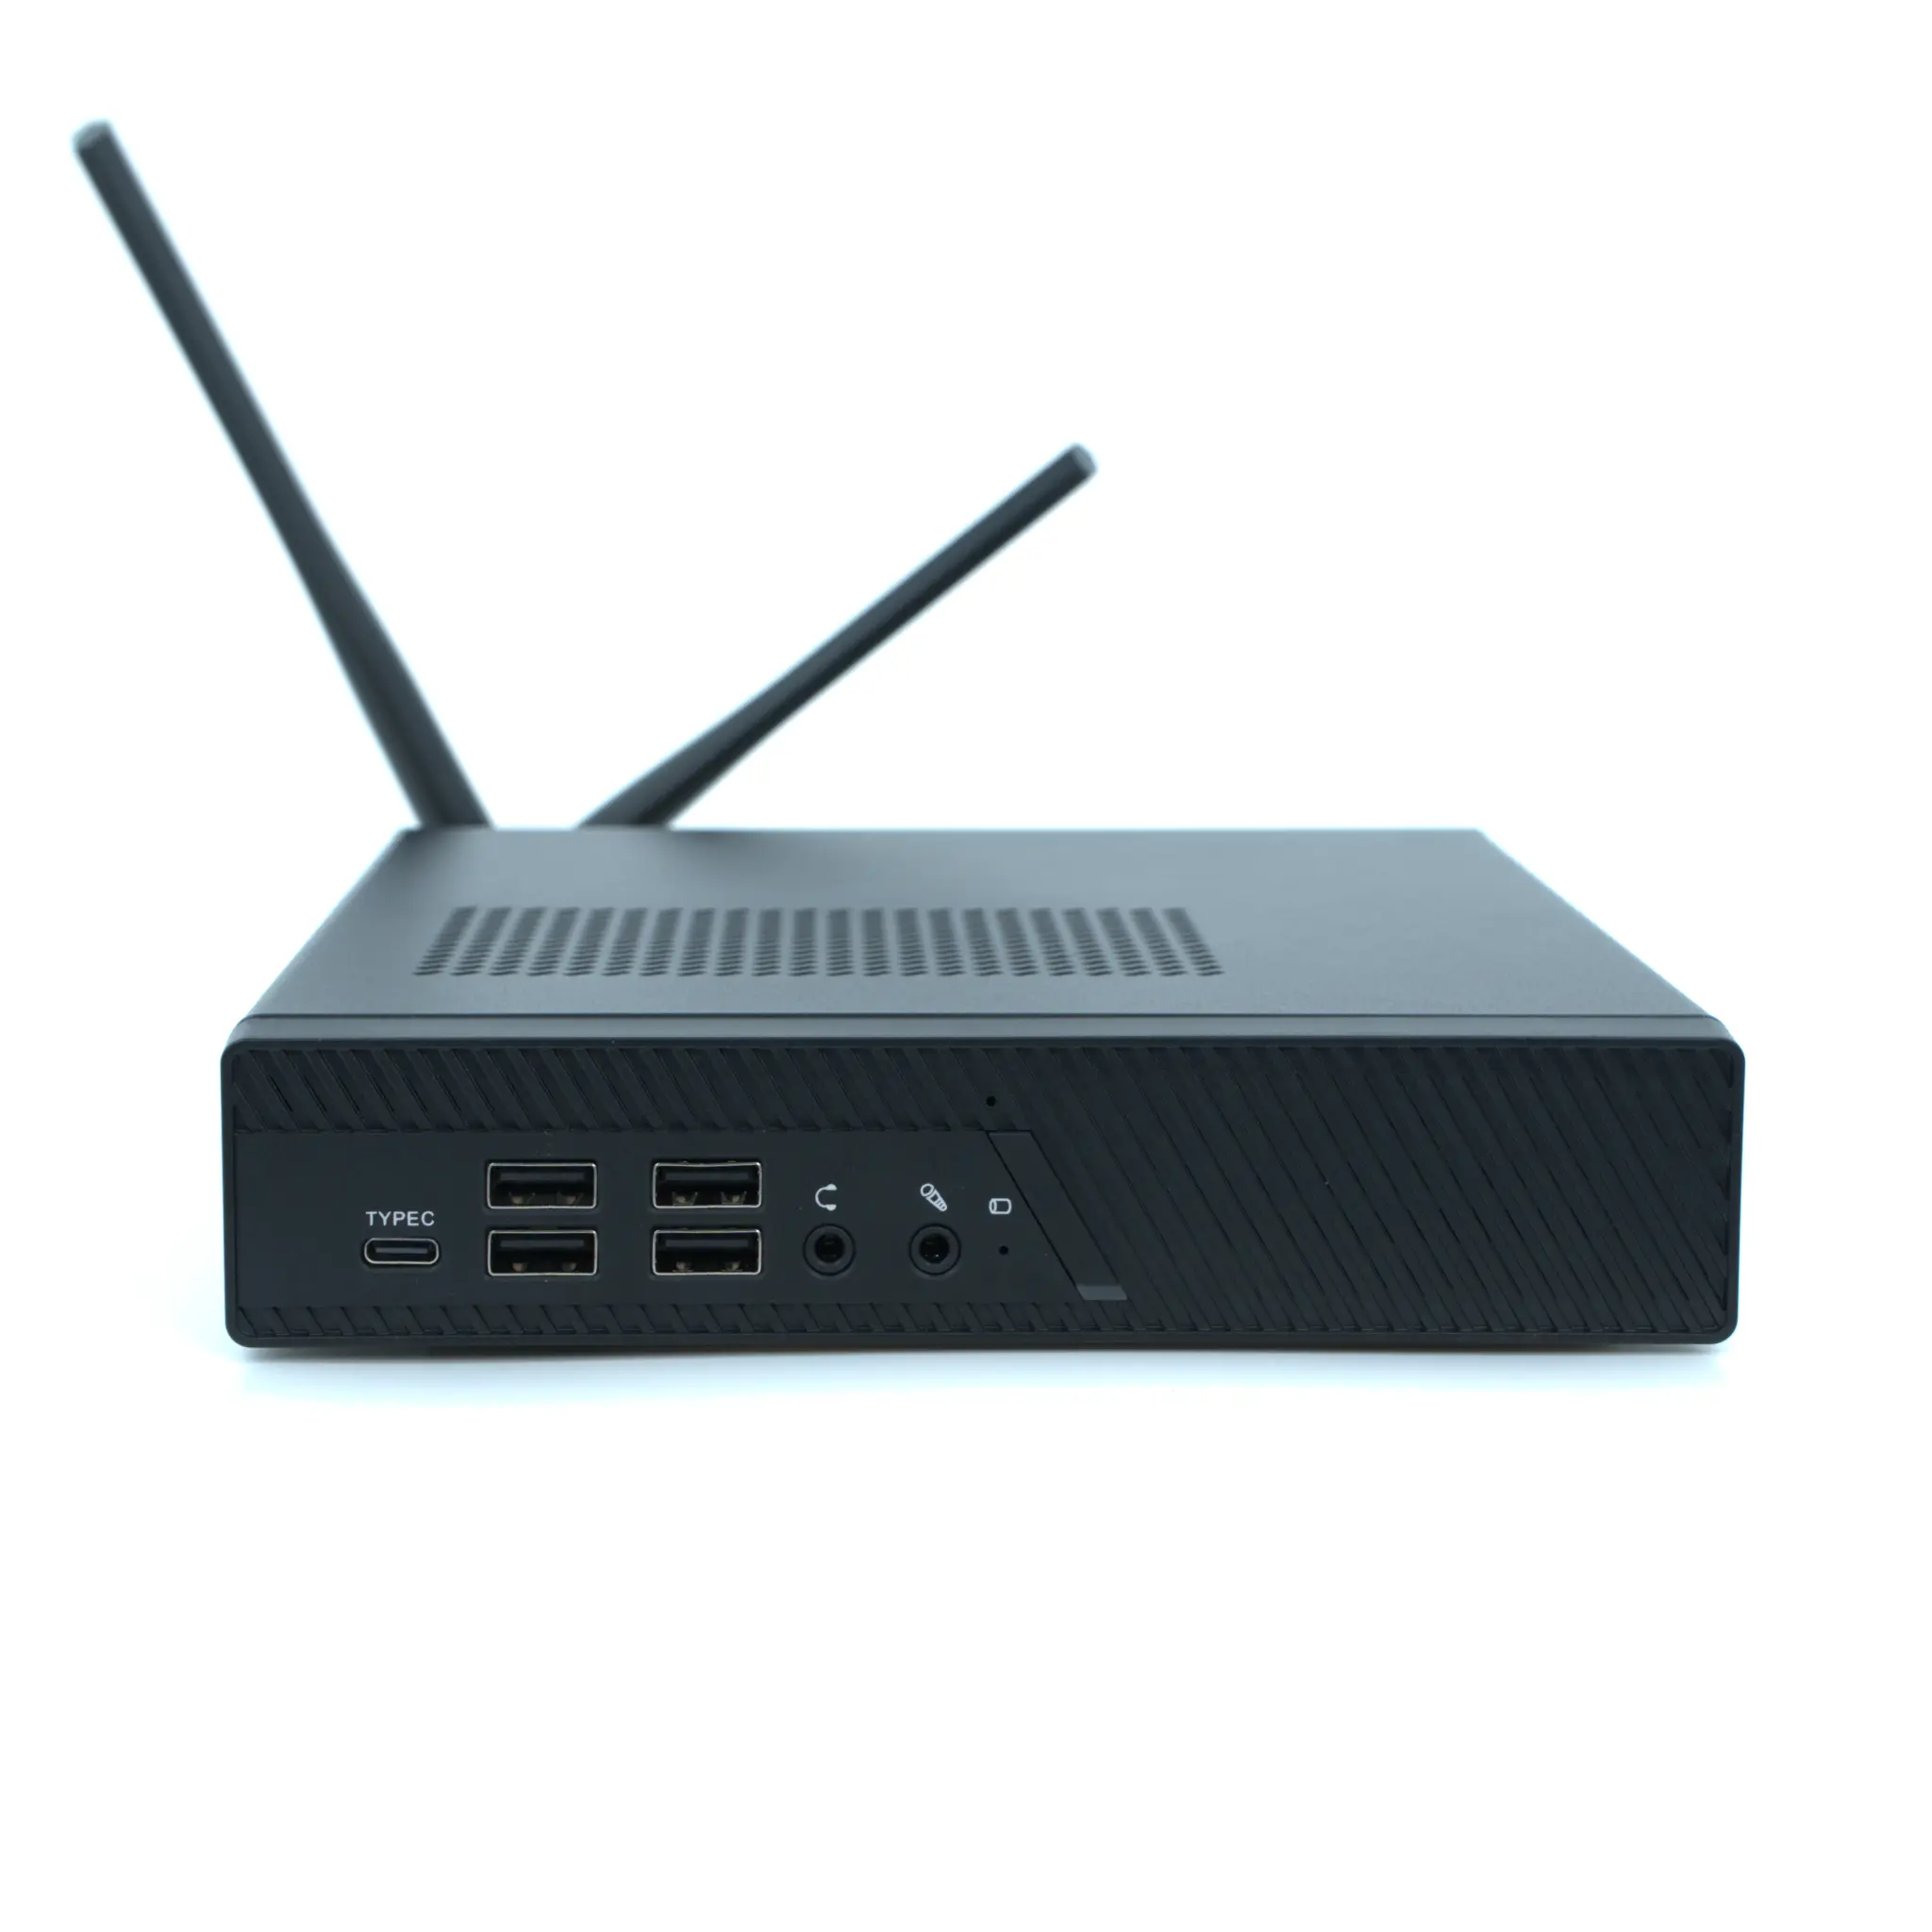
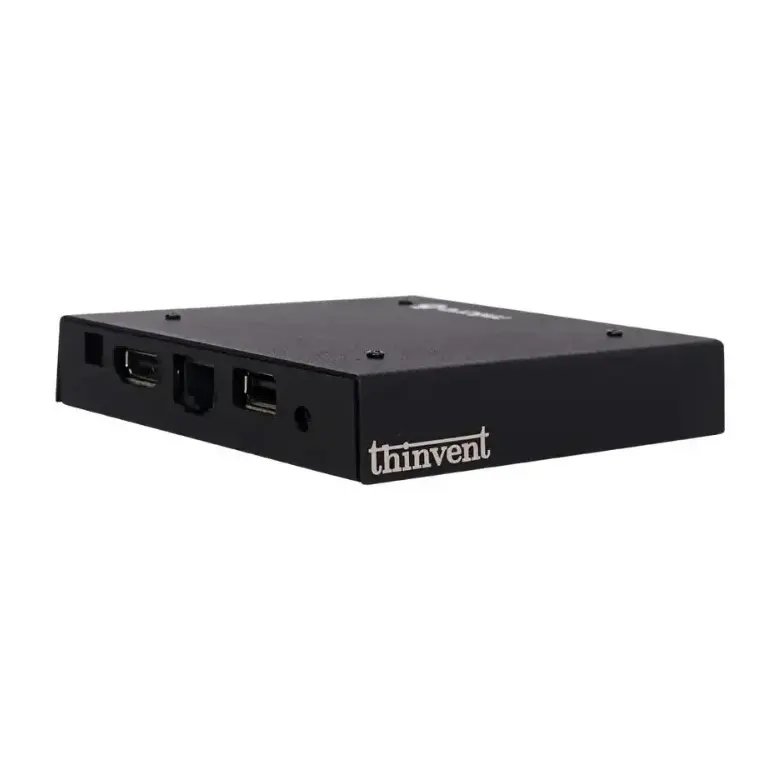
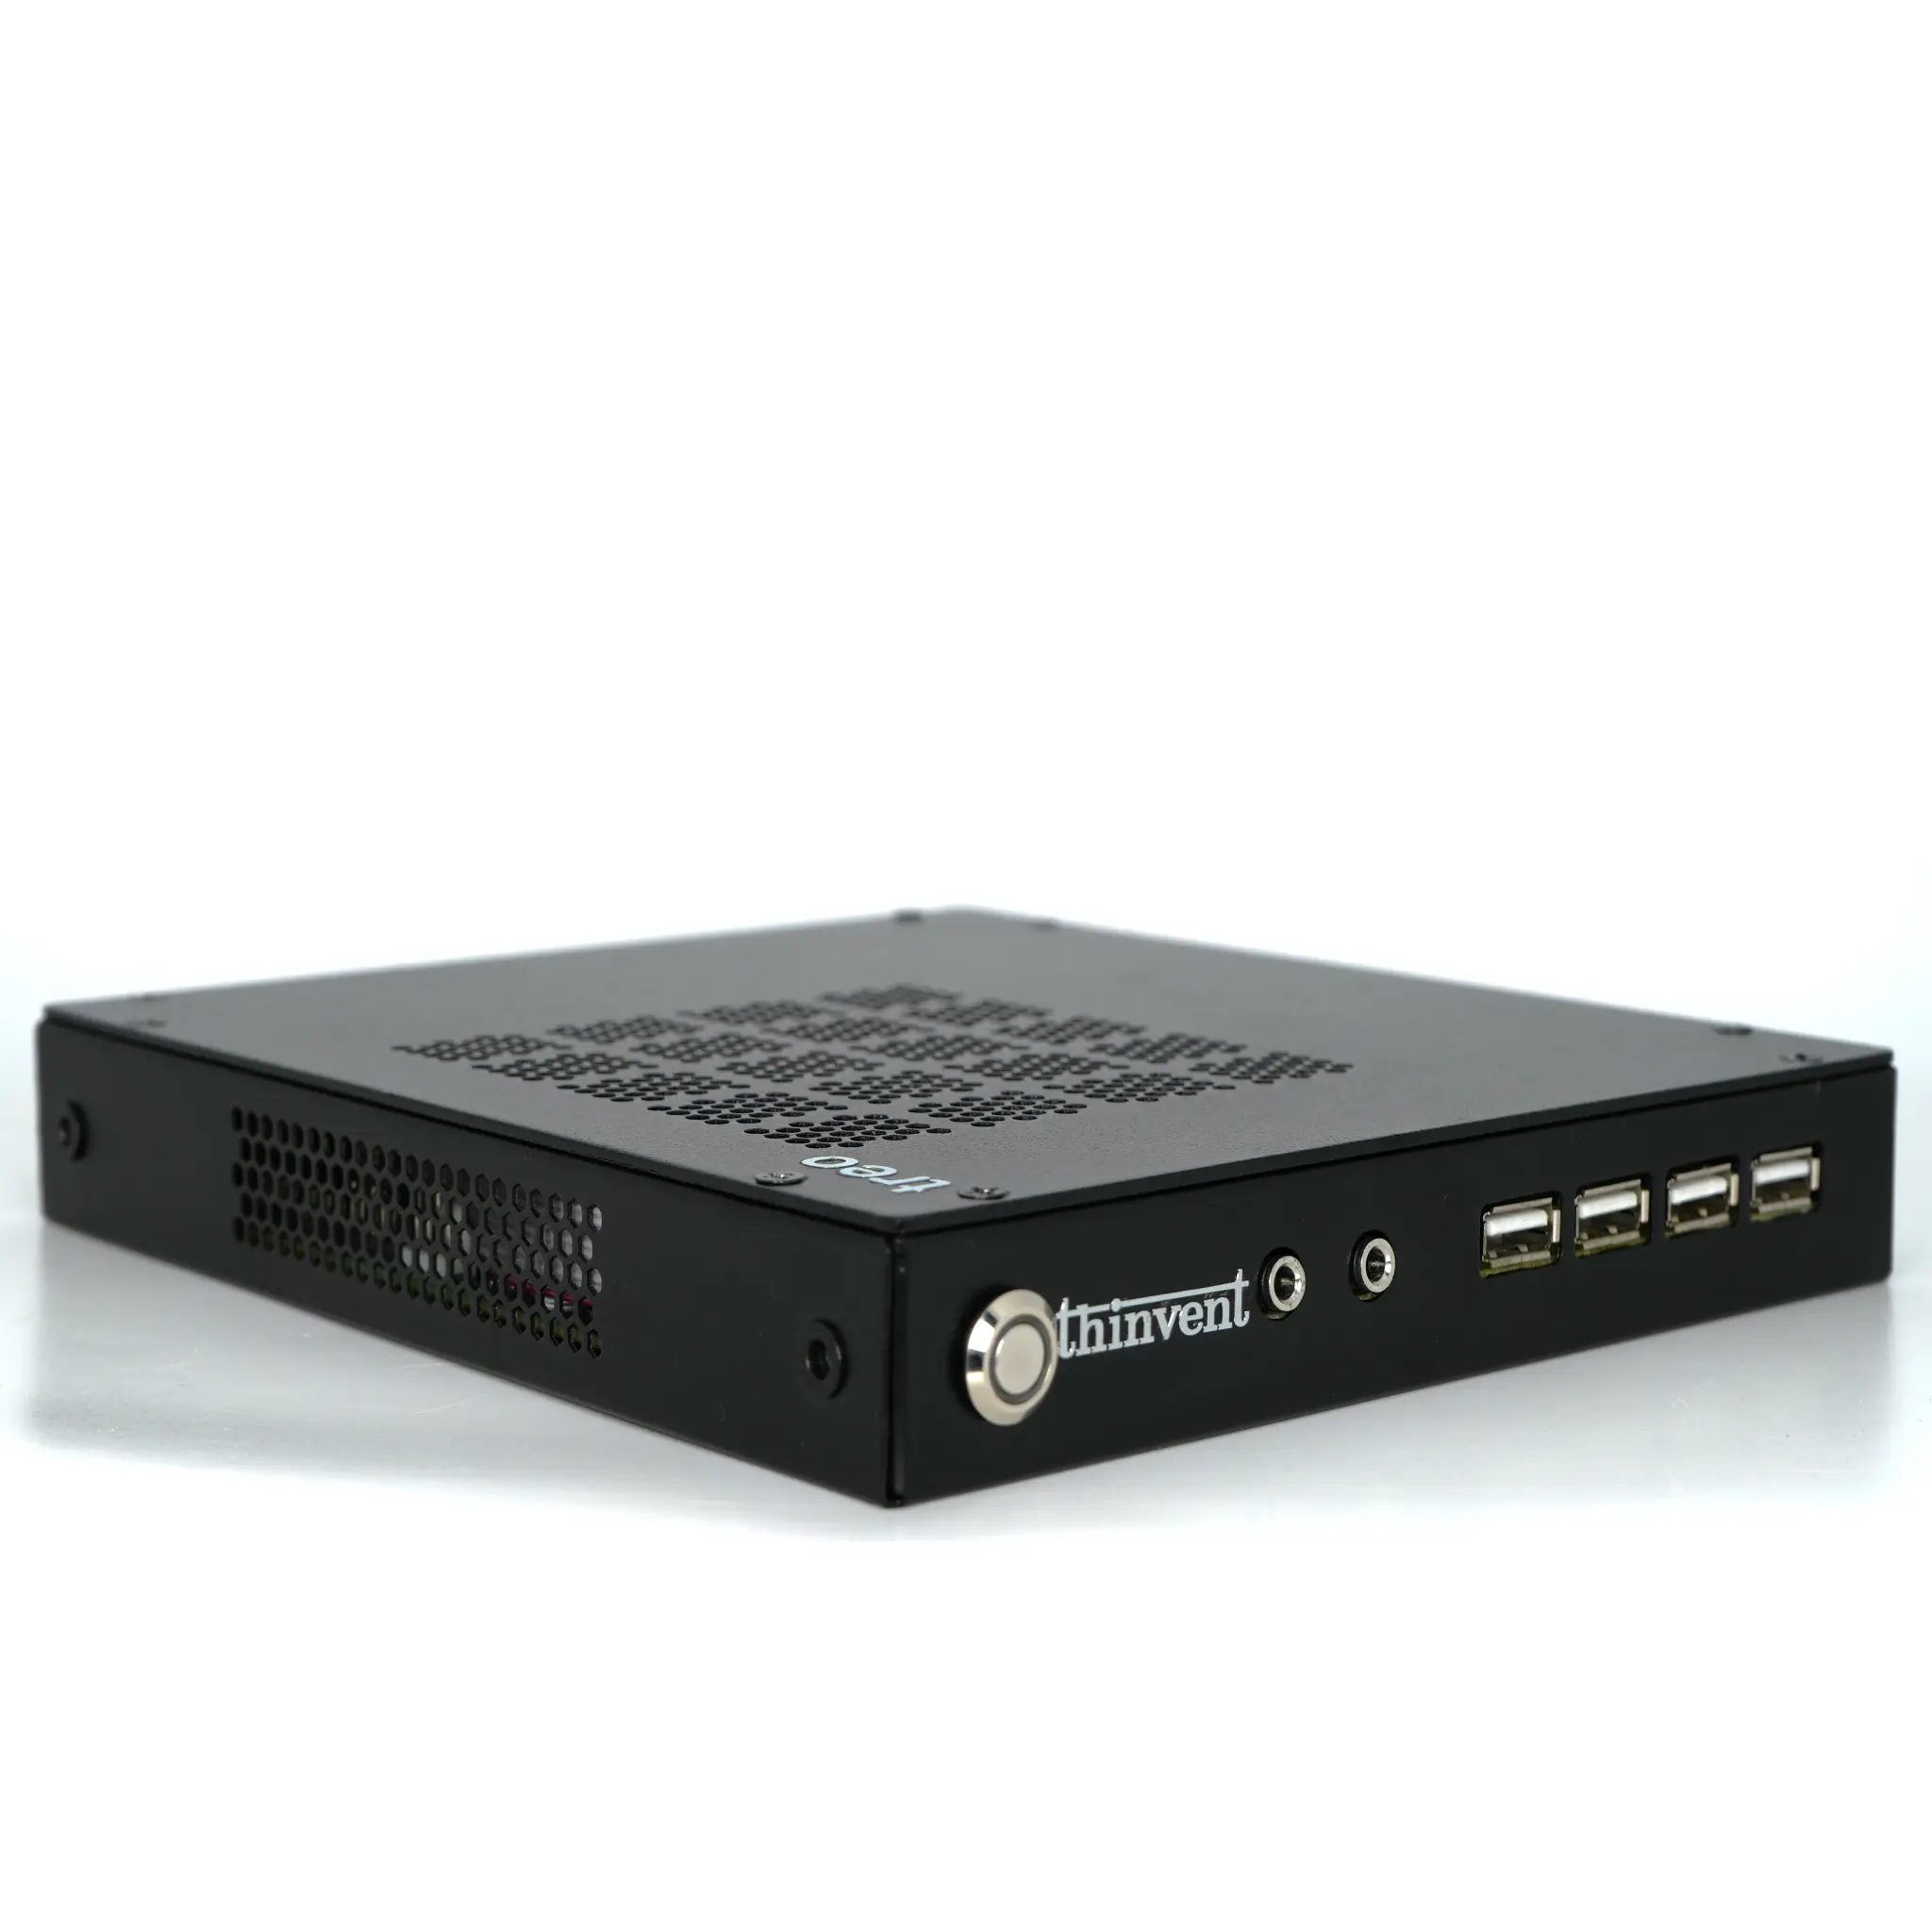
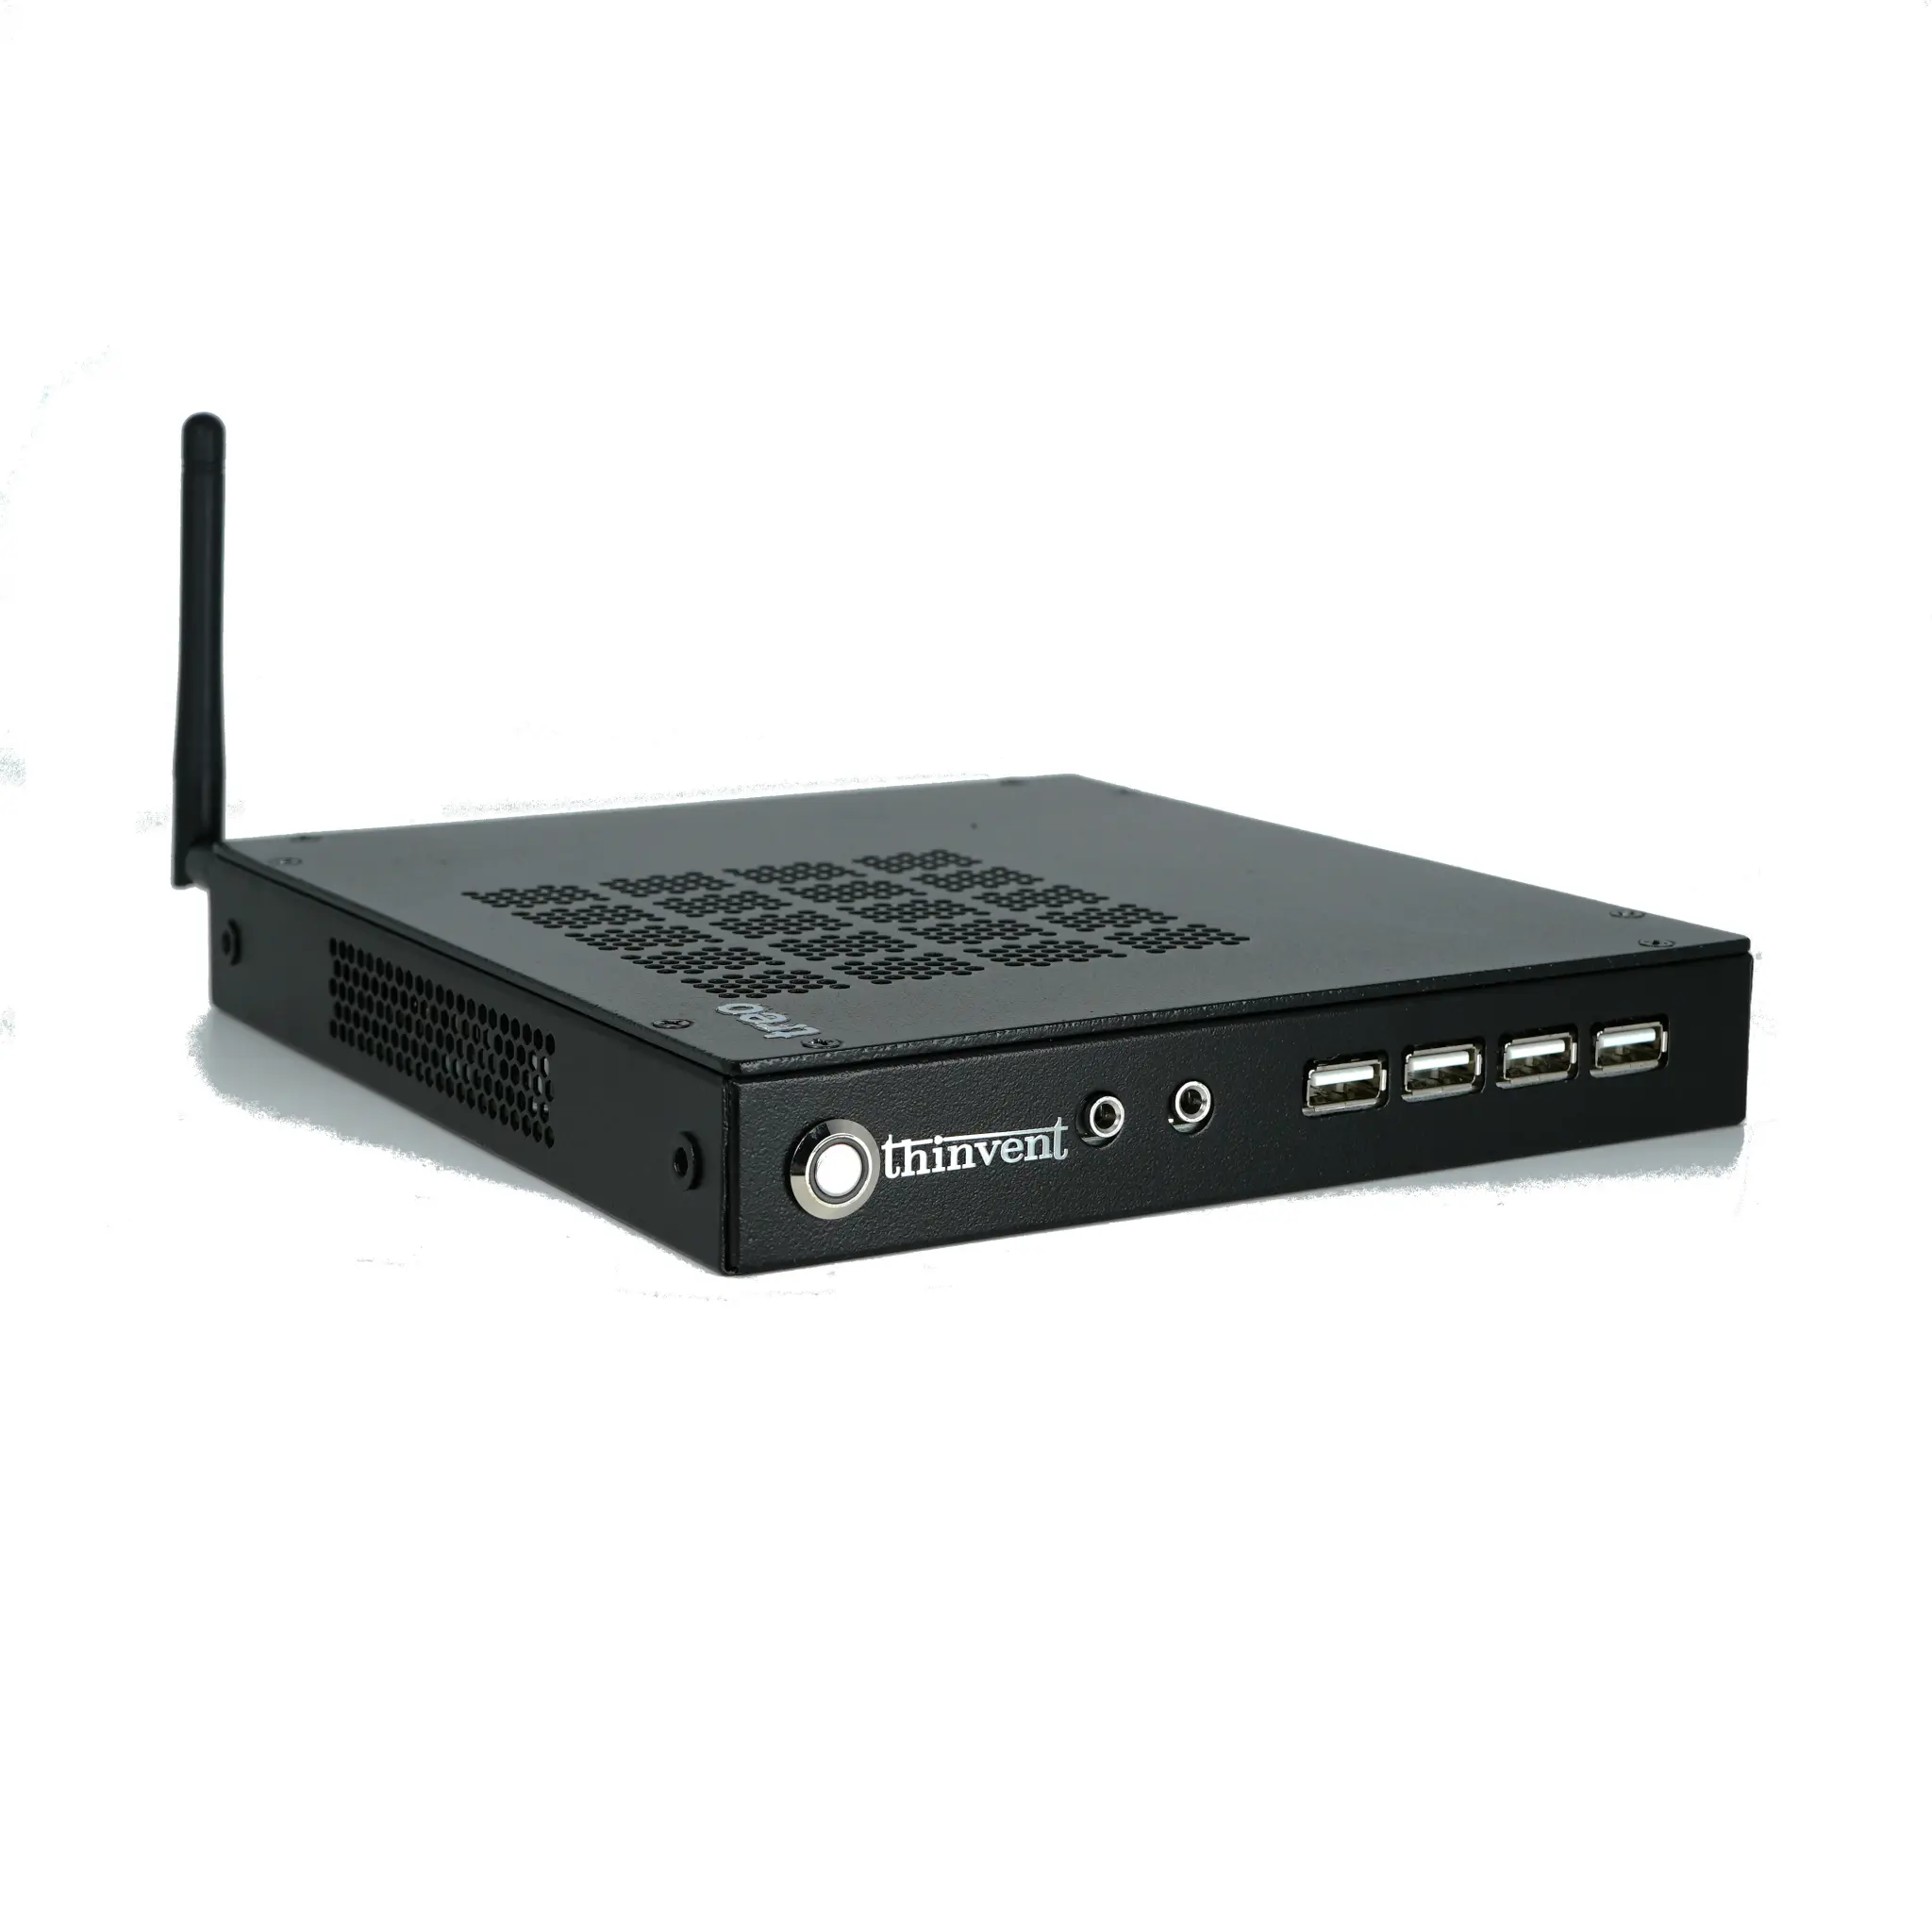
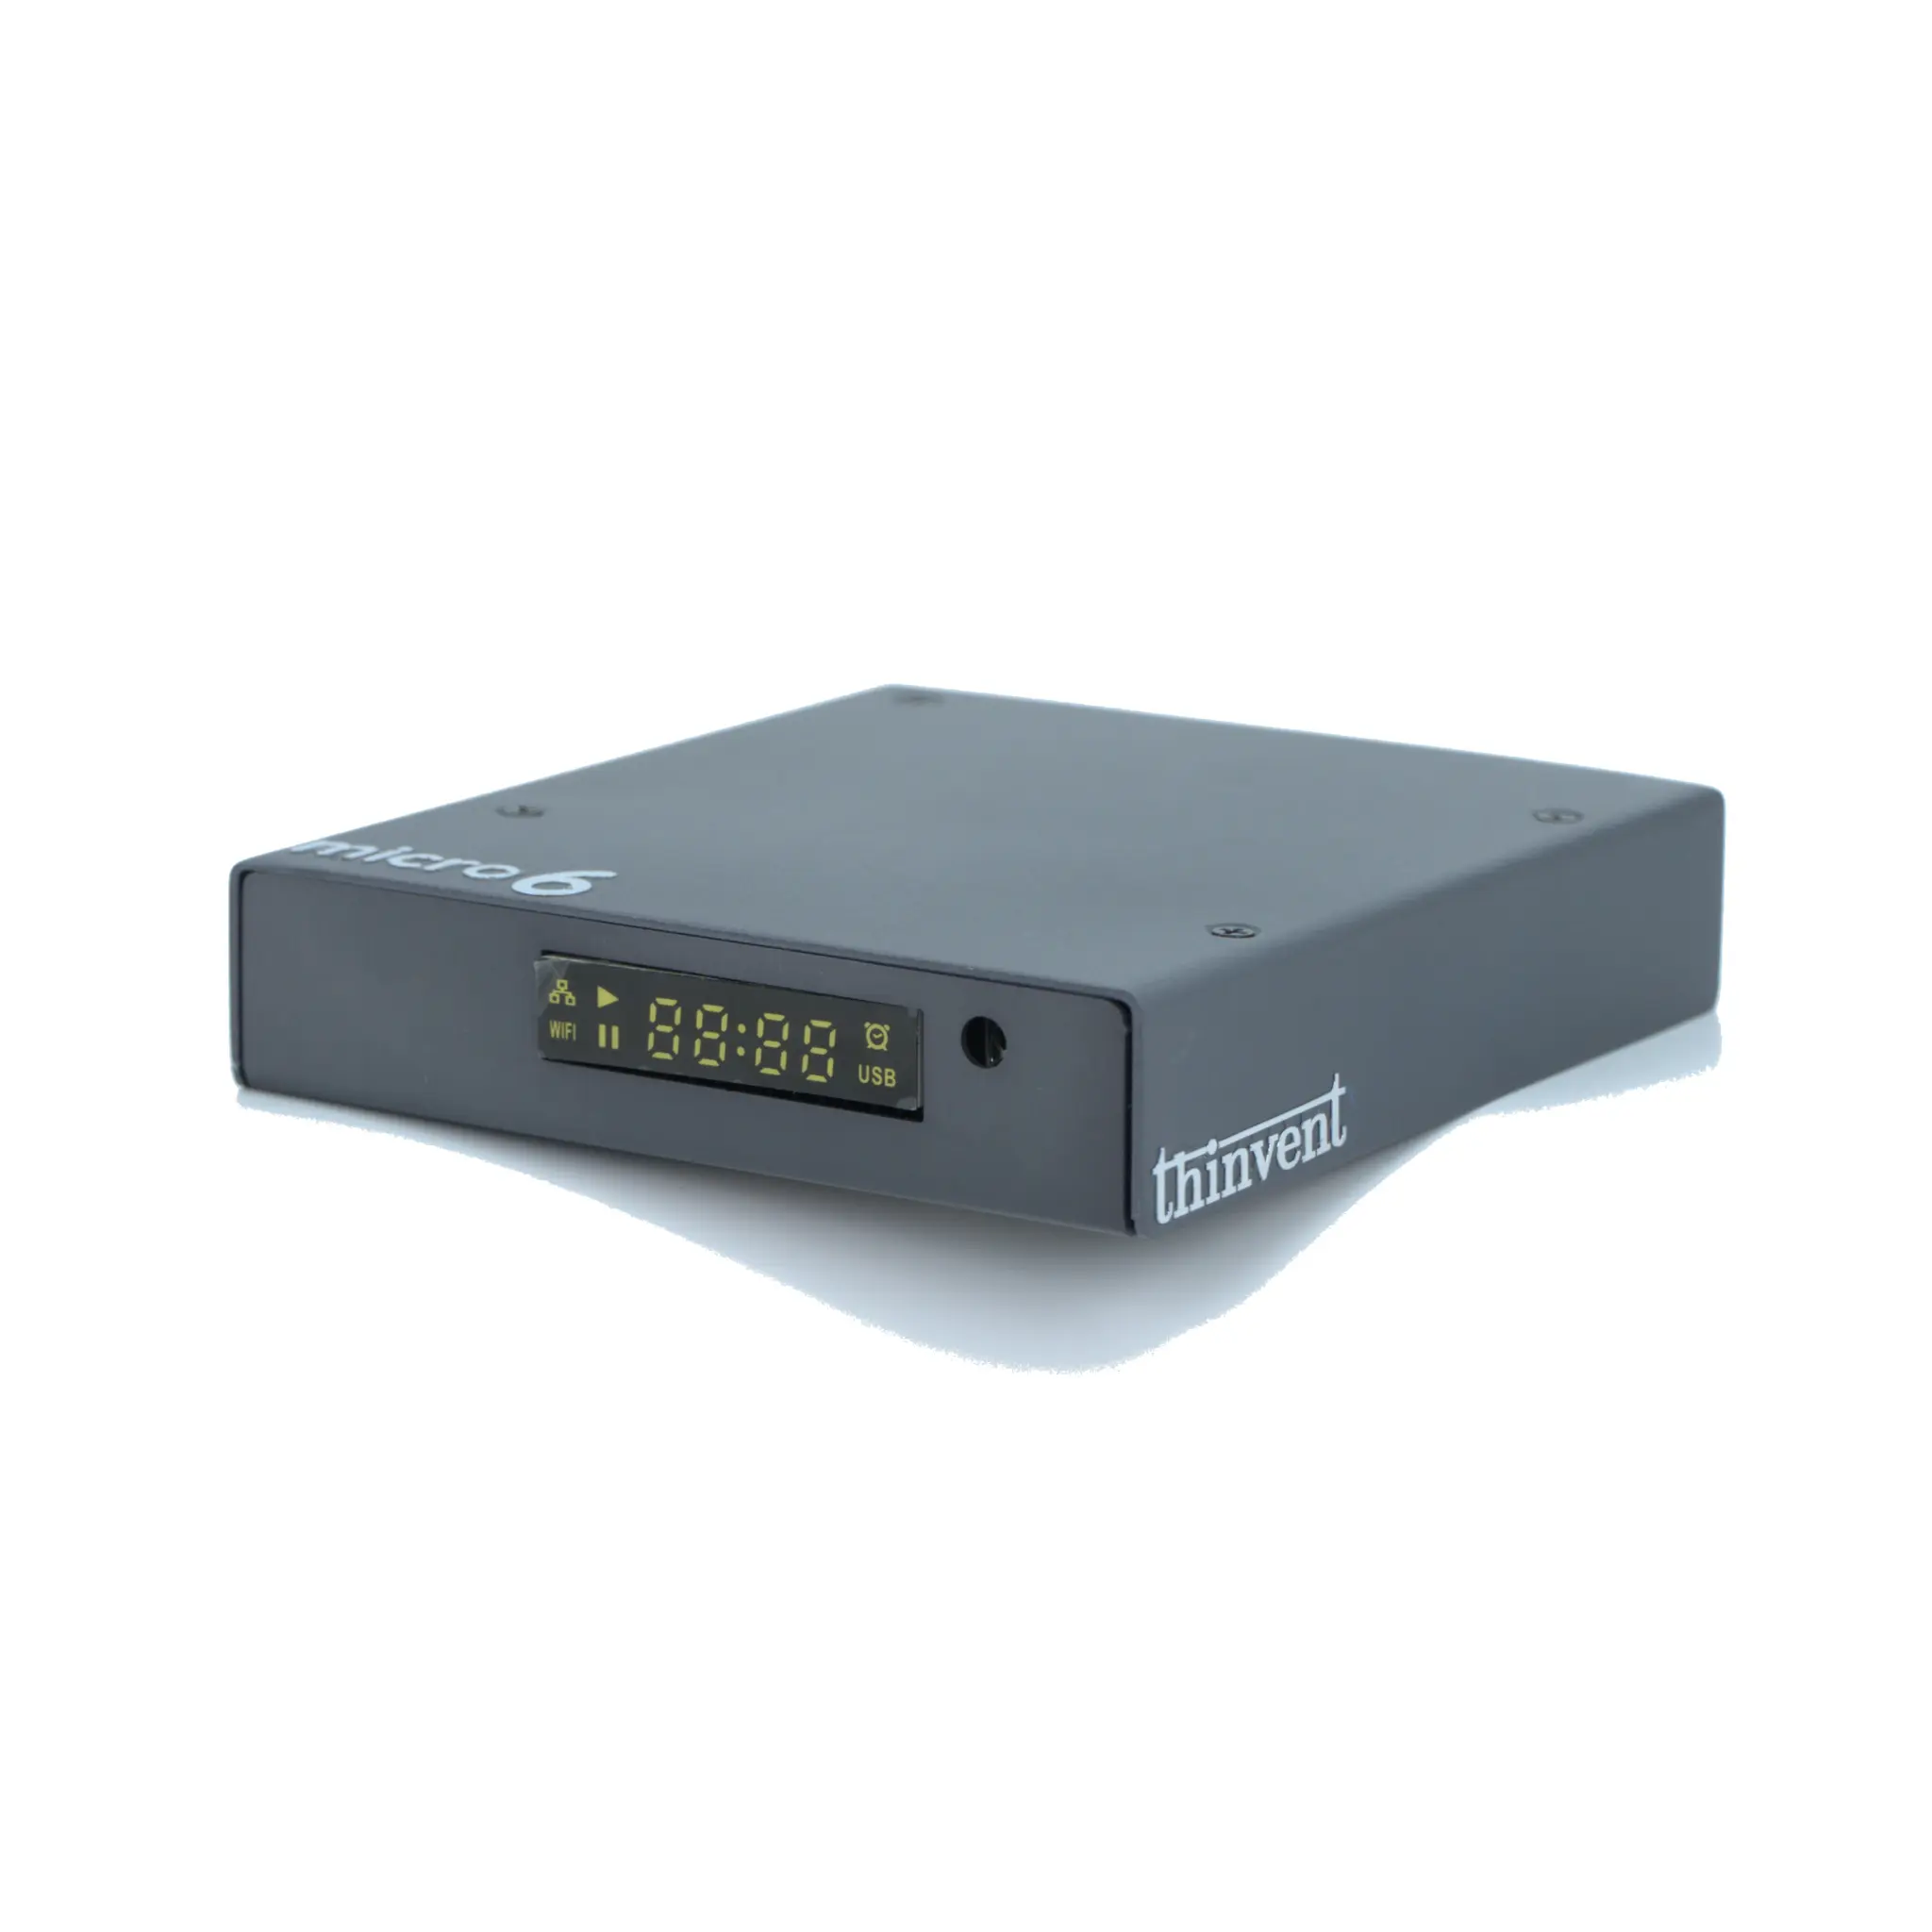
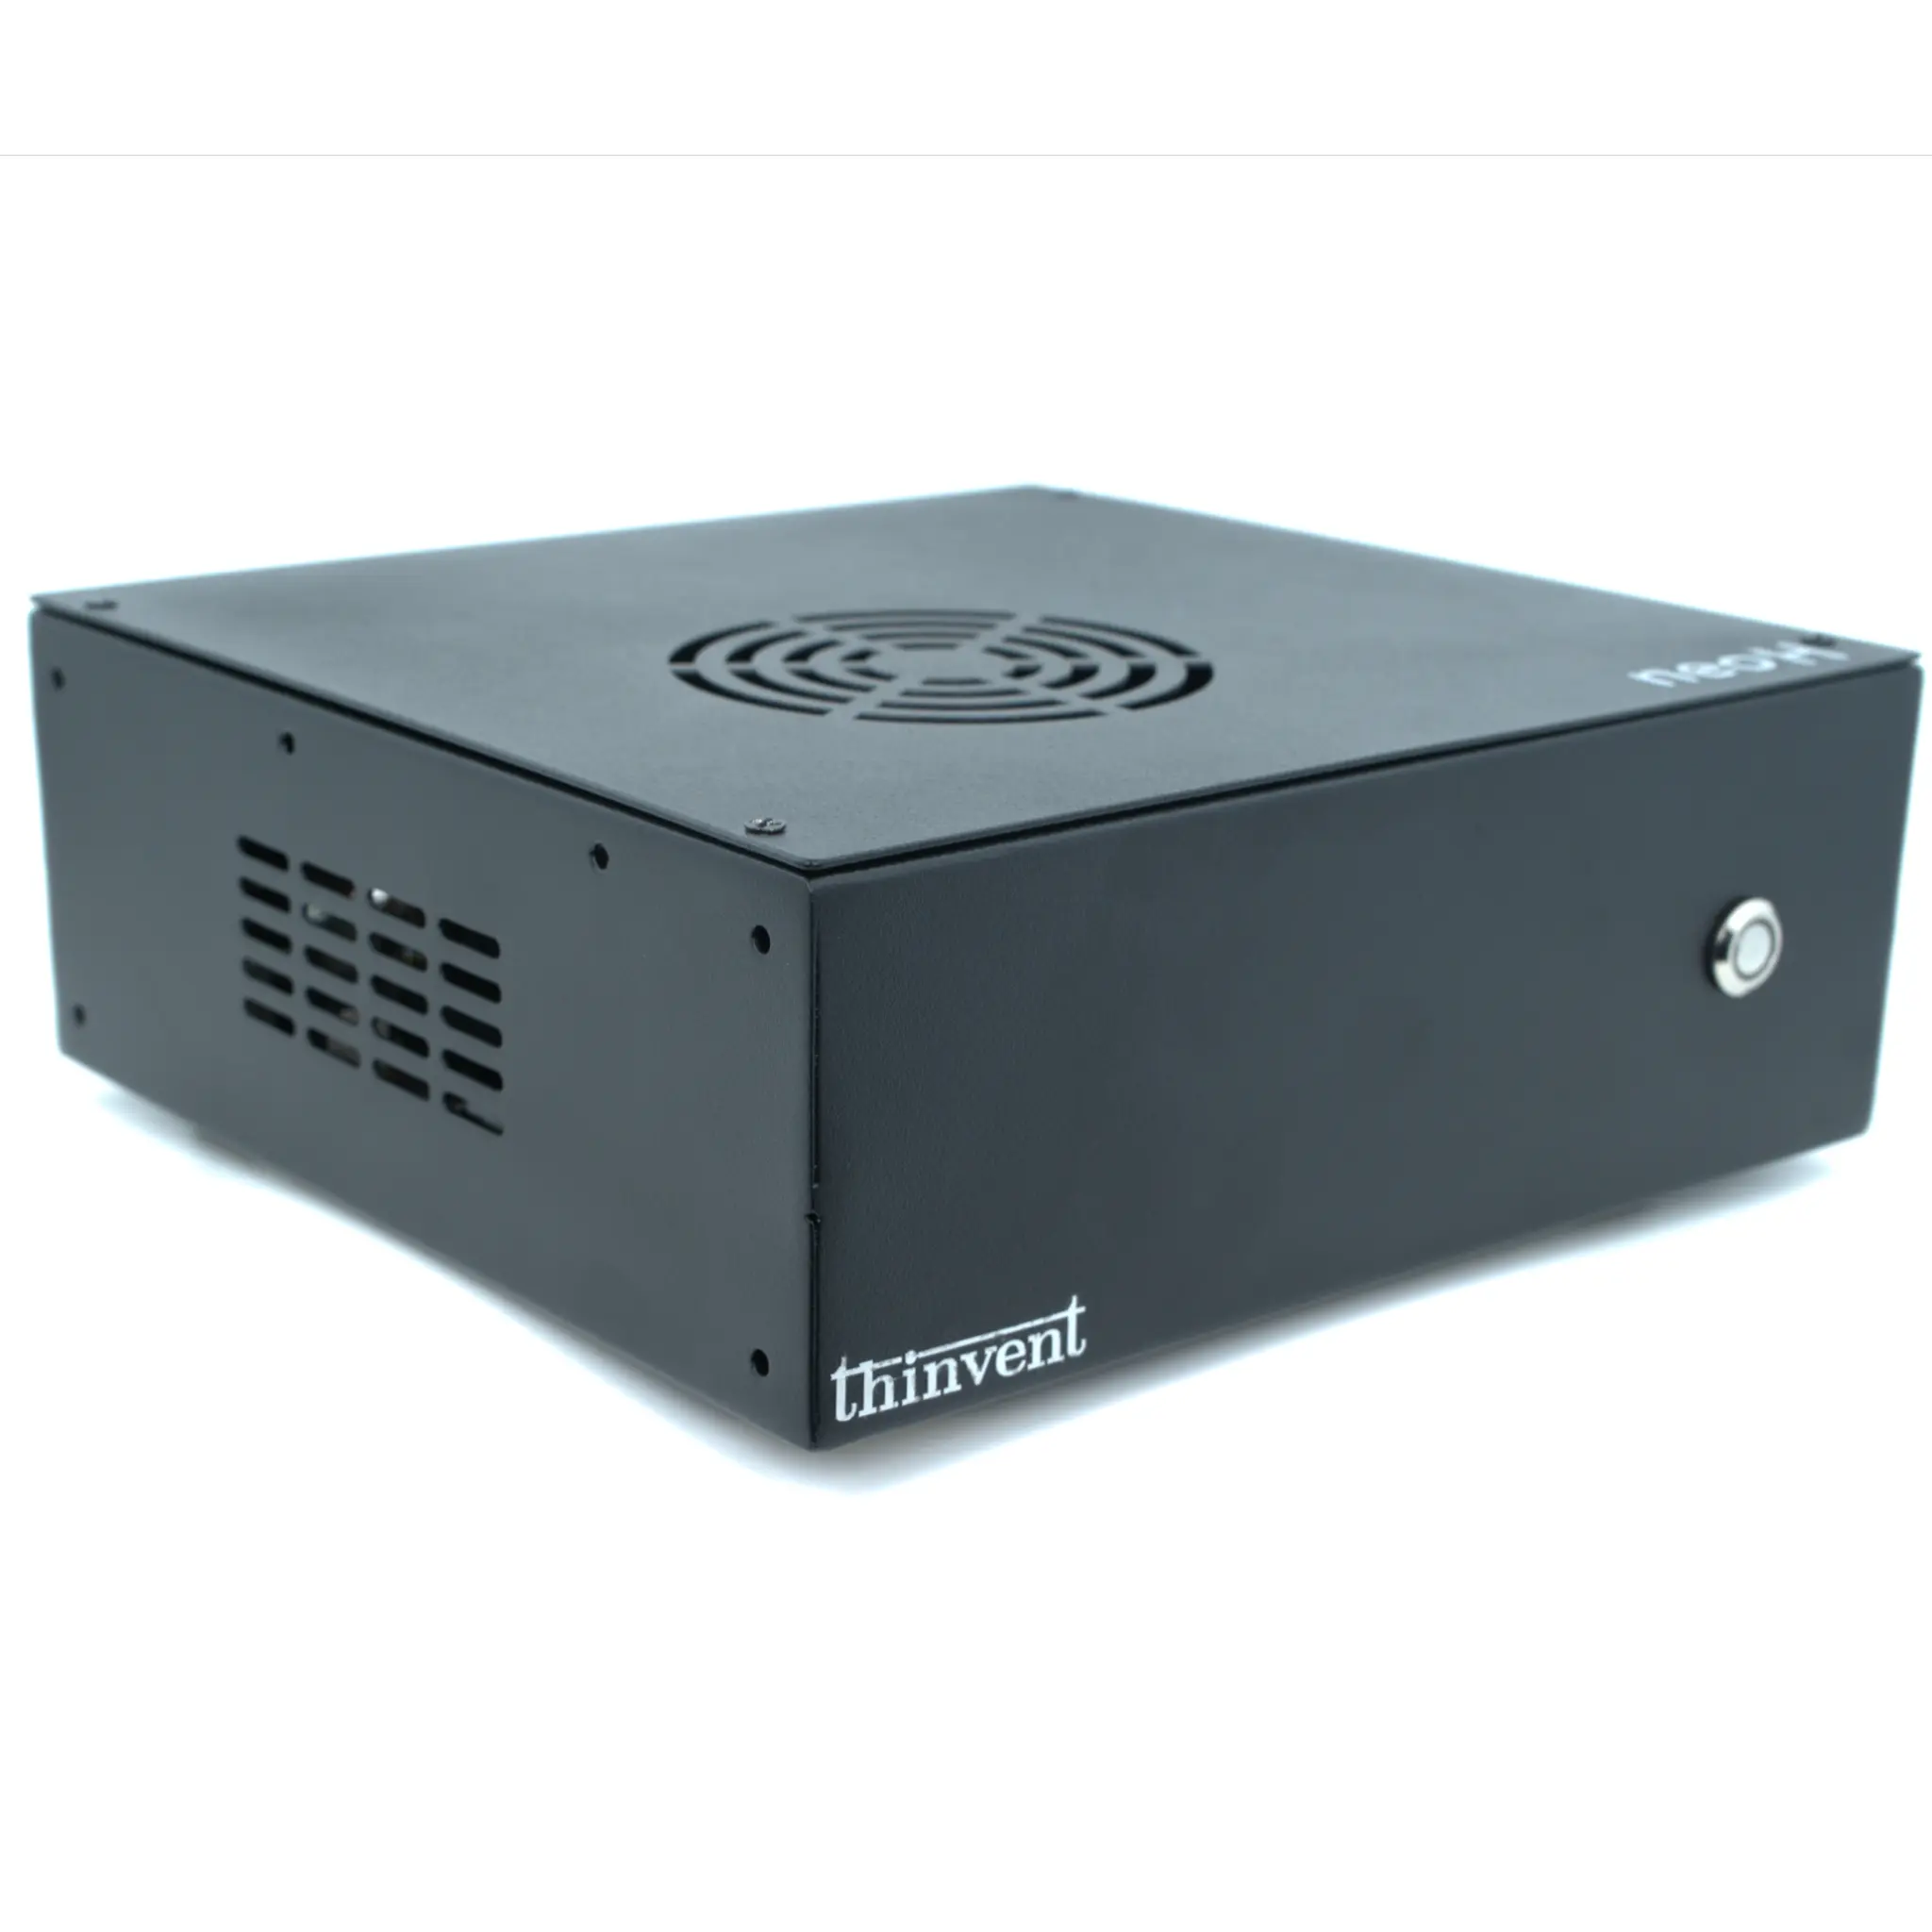
Thinvent builds fanless mini PCs, industrial computers, thin clients and all-in-one PCs suited to graph analytics, visualization and dashboard rendering. Configurations pair Intel processors with 4GB to 64GB DDR4 memory and SSD storage from 128GB upward, running Windows 11 Pro, Ubuntu Linux 24.04 LTS, embedded Linux or without an OS for custom deployments. Dual HDMI, Gigabit Ethernet and multiple USB 3.2 Gen 2 ports support multi-display graph workstations and edge data collection nodes, while the sealed fanless chassis keeps them running quietly in dust, heat and continuous-operation settings.